This paper from Endress + Hauser, discusses the increase in understanding and necessity of monitoring and controlling energy efficiency in utilities.
1. Introduction
Production plants in all industries are coming more and more under pressure to measure the cost of their utilities:
– Water
– Air
– Gas (e.g. Natural Gas, other gases or fuels)
– Electricity and
– Steam
It is interesting to confirm that this W.A.G.E.S. trend is independent of the type of industry. It is to be seen in small breweries and in big chemical sites.
One important driver for this pressure is the rise in the cost of energy. The cost of natural gas for industrial applications has more than tripled within less than ten years and the price for electricity in Europe has risen by 30% within less than 4 years.
Certifications according to EMAS and the ISO 14000 series also force customers to measure the energy streams using calibrated technology.
The utilities have been neglected frequently in the past. Currently, however, they are coming more and more into the focus. Still many companies only measure natural gas and electricity only at the custody transfer point. Using these few measurements, however, important parameters like specific energy consumptions are determined that give important indications: how much energy does it take to make a ton of product? These measurements, however, are only taken on a monthly or sometimes even on a yearly basis. Investing a relatively small amount of money in comparative terms it is possible to set up energy monitoring systems that measure the consumption of each respective utility close to the point of use. These measurements can then be used to build meaningful relations between energy consumptions and driving factors that enable the customer to
• Control their energy consumption with a better resolution (application-wise and time-wise)
• Identify and justify energy reduction projects (where is most energy consumed? Which changes are possible?)
• Detect poor performance earlier (are the boiler’s heating surfaces fouling?)
• Get support for decision making (should the contract with the provider of electricity be changed?)
• Report performance automatically (which Energy Accountability Centre/shift etc. is performing best? Did exceptions occur?)
• Audit historical operations
• Get evidence of success (did promises made by a manufacturer of energy efficient equipment come true?)
• Get support for energy budgeting and management accounting
• Provide the energy data to other systems (e.g. existing SCADA)
2. What is energy management
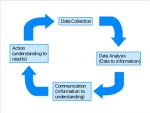
Picture 1: The Energy Management Cycle.
Energy management can be seen as a cyclic operation. Everything starts with the basic data collection: energy consumption is measured and converted to appropriate units. For most of the utilities, these conversions require highest attention:
– already the conversion from volumetric units (e.g. natural gas measured by turbines, steam measured by DP devices or vortex meters) to corrected volume, mass or energy often is done in a wrong way resulting in errors in the range of typically 10…30%
– many devices are wrong installed resulting in similar error ranges and
– if already the basic is wrong, the analysis will be wrong and all action taken will be based on wrong information.
The easiest form data collection is paper and pencil. It is amazing to see how many people in the industry still have to walk around the factory and find certain meters on a monthly basis to take the readings. Modern systems perform this automatically: Modern recorders as stand-alone devices or so-called “software recorders”are able to record data in the commonly used 15 min. or 30 min. intervals. If these intervals are not sufficient, even a data collection every 100ms is possible.
Most modern systems of data collection are even able to collect the data of up to 30 devices using bus communication and pass the data on using “Field Gates”.
3. Data analysis
If the Data collection is the basis of it all, data analysis is the heart: It helps to convert the pure measurements of energy data into meaningful data.
A first basic way consists in analyzing the 15-min or 30-min data profiles:
– What is the base-load of the application? Why energy is still consumed without production? How can this base-load be reduced?
– What is the typical maximum load during productive hours? How can the maximum load be reduced? (This is important e.g. for electricity contracts)
– What is the typical load distribution? How can a more uniform load-distribution be obtained?
For this purpose, different policies of load-management are available (e.g. peak-clipping)
Even more meaningful is to put energy consumptions into relation to a driving factor. Examples are:
– how much heating energy is consumed compared to how cold the weather is (so-called degree days)
– how much energy is consumed to make a ton of product
– how much electricity is consumed in order to light a building compared to the hours of day-light.
Since all of these parameters put into relationship energy consumption with a relevant driver, they are generally called “Specific Energy Consumptions” (SEC).
Controlling such a factor now enables the customer to control if a certain process is drifting over time, i.e. the process is becoming more in-efficient. Possible causes of such a drift can have multiple reasons:
– the amount of leakage in a compressed air grid is growing because of lacking maintenance
– the specific energy consumption for making steam is rising because of lacking maintenance of steam traps (steam traps fail open in case of a failure)
– the specific energy consumption for heating a building rises because of fouling of the surfaces of heat-exchangers
Generally, comparing the energy consumption with a driver will reveal a linear relationship. In certain applications, this linear relationship also shows an intercept that does not equal zero.
If no actions are taken, the trend will be as follows:
– the intercept grows (examples: increasing leakage in a compressed air application or due to failing steam traps)
– the slope of the linear relationship grows (loss of efficiency e.g. because of fouling heat-exchangers)
Customers, however, will strive to
– reduce the intercept and
– reduce the slope of the linear relationship.
The linear relationship found can now be used as a target for the future. One example: if in the past it has taken 4 GJ of energy to make a ton of steam, we expect this same value for the future, too – unless we take any actions to improve efficiency.
We can now compare the real energy consumption to the expected one and record the differences. If this difference exceeds a certain value, a warning will be generated.

Picture 2: The Control Graph for controlling deviations from a pre-set target. If the control limits are exceeded, an alarm can be generated
We can also take these differences and total them up over time in the so-called CUSUM (cumulated sums) chart.

Picture 3: The CUSUM chart. It acts as a totalizer and can reveal savings achieved.
This chart acts like a bank-account: If the process becomes less efficient, the CUSUM chart will run away from the zero line. In the picture the process has become more efficient, however. In our example, an economizer was installed improving a steam boiler’s efficiency. We can now read directly from the chart that compared to former performance the investment into the economizer saved the company 1100 MWh of energy within 15 weeks.
Where this data analysis can be done?
Recording the performance, analyzing data every 15 or 30 minutes and displaying current specific energy consumption values can be done easily using modern time recorders that display these values close to the process. These modern recorders already can perform even complex math operations. Thus, employees running certain processes can be directly involved and start asking questions:
– Why are certain shifts more efficient than other?
– Why was the specific energy consumption stable for months but started drifting recently?
These analysis techniques and also the “targeting” procedure described above can also be performed in Energy Monitoring software.

Picture 4: Set-up of a typical full-blown energy monitoring information system
4. Communication/reporting
Recipients of Energy reports can be found in different hierarchies: from operations personnel to top management and in different areas of a company (production/operation/engineering, controlling, energy and eco management).
The reports must provide information to enable the user to act. Operational staff needs to know when a problem has occurred as quickly as possible and know what they should do about it. Senior management, on the other hand, needs summary information to know that procedures and systems are working well. In order to design reports, it is important to understand who needs reports and why.
Reports to senior management might include:
– a summary of last year’s costs, broken down into EACs (energy accountable centers)
– a summary of the current year’s performance on a monthly basis
• against budget
• against the previous year
• against targets
– a note of the savings (or losses) achieved to date and how they were achieved
– a note of additional savings opportunities and what actions are ongoing to address them
A new report to management should be issued each month and be available in time for board meetings.
Operations management will be responsible for operating processes and plant efficiency. They will need to know on a shift, daily, weekly or monthly basis (depending on the nature of the process and the level of energy use) what energy has been used and how this compares with various targets. The information will be used to
– measure and manage the effectiveness of operations personnel and process plant and systems
– identify problem areas quickly
– provide a basis for performance reporting (to executives)
Operations personnel need to know when a problem has occurred and what needs to be done to rectify it. This information needs to be provided in a timely manner, which might mean within a few minutes of the event for a major energy-using process, or within a day or a week.
Engineers associated with operations will need reports similar to those for operations personnel. Engineers may typically be involved with problems where there is more time to act (compared with process operators), for example, cleaning heat exchangers, solving a control problem or removing air from a refrigeration condenser.
Engineers who are not directly in operations but who provide support will need more detailed historical information. Typically, these individuals will be involved in analyzing historical performance, developing targets and modeling. They will require access to the plant data historian and will use analysis tools, ranging from commonly available spreadsheet software to advanced data mining and similar software.
Engineers that are involved in projects will need supporting data, for example, levels of energy use, process operating conditions, etc. They will also need access to the raw data in the historian and access to analysis tools.
The accounts department may be interested in actual energy usages and costs to compare with budgets. They will need information that is broken down by department so that costs can be allocated to related activities. Accurate costing of operations and the cost of producing goods can improve decisions regarding product pricing, for example, and the allocation of resources.
Energy and environmental managers will need summary data that identifies the performance achieved and trends, much like what executives and operations managers require. Like engineers, they may require more detailed information for specific analysis.
The environmental department may want energy consumption expressed as equivalent CO2 emissions, and the energy reports may need to be integrated into environmental reports that are more general. Summary information may be required for annual energy and environmental reporting and may be needed more frequently by regulatory bodies.
The energy manager may be involved in energy purchasing as well as efficiency. He may need information about the profile of energy use (using a half-hourly graph, for example), peak usage, nighttime usage, etc. The energy manager will also need access to the raw data in order to allow evaluation of purchasing options and to check bills.
We can see from this broad variety of requirements that modern Energy Management Information Systems have to be very flexible in creating these reports.
5. Taking the action
Results of implementing Energy Monitoring Informations Systems in the UK indicate that, when properly implemented, such a system can save 5 to 15 percent of annual energy costs. As an initial approximation, 8 percent appears to be a reasonable estimate. [1]
Implementing an Energy Management Information System alone and taking the action based on the outcome of this tool alone will result typically in 8 percent savings. Most experience regarding this tooling can be found in the UK based on the local “Carbon Trust”.
Further savings can be achieved by spending capital cost e.g. for more efficient burners and boilers, economizers etc.
Savings Strategies in Energy Management typically fall into the four following categories:
• Eliminate. Generally, one should question if certain processes or sections of a plant are really required or if they could be replaced. A simple example: eliminating dead legs of a plant.
• Combine. CHP is a well-known “combine” process: generation of heat and electricity are combined. Another example is the use of off-heat created by compressors for making air e.g. for pre-heating factory air.
• Change equipment, person, place, or sequence. Equipment changes can offer substantial energy savings as the newer equipment may be more energy efficient. Changing persons, place, or sequences can offer energy savings as the person may be more skillful, the place more appropriate, and the sequence better in terms of energy consumption. For example, bringing rework back to the person with the skill and to the place with the correct equipment can save energy.
• Improve. Most energy management work today involves improvement in how energy is used in the process because the capital expenditure required is often minimized. Examples include reducing excess air for combustion to a minimum, reducing temperatures to the minimum required. Improving does sometimes require large amounts of capital. For example, insulation improvements can be expensive, but energy savings can be large, and there can be improved product quality.


 Posted by Eoin Ó Riain


